

Overview
A US technology company that builds custom mobile apps and enterprise mobility software came to Clickorio for one thing: a steady pipeline of qualified B2B leads from Google Search, with tight control over what each one cost. Over twenty months the account spent $19,673 and returned 472 leads at a blended $41.68 each, at a 9.63% click-through rate and a 15.57% click-to-lead rate.
The Pain Point
App development is one of the most crowded, highest-CPC categories on Google. The same keywords are fought over by offshore development studios, no-code platforms and large IT consultancies, so a broad campaign burns budget on traffic that never had buying intent. Three problems had to be solved before a single dollar of spend could be justified:
- Budget was fixed, patience was not. The account had to produce leads from month one, so there was no room for a long learning phase.
- No conversion history to automate on. Smart Bidding needs a steady volume of conversions before it performs. Handing it the auction on day one would have meant paying for the algorithm’s education.
- Expensive clicks, mixed intent. At around $6.49 a click, every irrelevant search term was money gone, and the category is full of them.
The Solution
We ran the account the slow way on purpose: manual CPC, a tightly scoped keyword set, and conversion tracking proven before the first campaign went live. That gave us a cost-per-click lever to pull from week one, and a reliable baseline to measure every later change against.
Once the account had enough conversion data to trust, the levers moved from bids to audience and device signals, pushing budget toward the segments that were already converting rather than widening the net.
What We Did
1. Built the account around high-intent keywords
Keywords were mapped by intent, not volume. Terms used by businesses hiring an app development partner were separated from the far larger pool of tutorial, template and “how to build an app” searches, and a negative list kept students, job seekers and freelancers out of the account.
2. Kept the auction on manual CPC
With no conversion history to feed automation, manual CPC gave direct control over cost per click while the data built up, and a clean baseline to measure against.
3. Wrote ads that asked for the click
Every ad carried an explicit call to action and matched the landing page’s promise. That is what lifted click-through rate to 9.63%.
4. Tuned audience and device bids
Audience layers and device-level bid adjustments pushed budget toward the segments that converted, raising the click-to-lead rate to 15.57%.
Results
Campaign period: December 2023 – July 2025
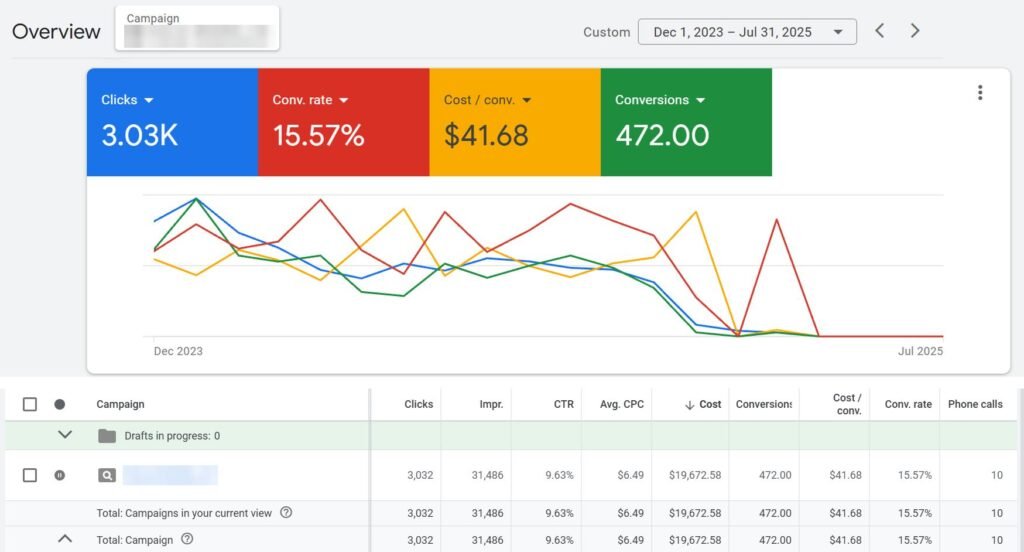
Straight from the Google Ads account.
472 leads at $41.68 each. A 9.63% CTR and a 15.57% click-to-lead rate show the right people saw the right message.
How That Compares
| Metric | Business Services average | This campaign | Difference |
|---|---|---|---|
| Click-through rate | 6.10% | 9.63% | +58% |
| Click-to-lead rate | 4.85% | 15.57% | +221% |
| Cost per lead | $93.69 | $41.68 | -56% |